
Best Practices for Establishing Data Integrity in Western Blotting
Western blotting is a fundamental technique, supporting protein detection, identification, quantitation, and providing insight into post-translational modifications. Despite advances in other proteomic methods, including mass spectrometry, western blotting remains one of the most widely used techniques across life sciences research due to its affordability, specificity, and widespread accessibility.
However, the integrity of western blot data has come under scrutiny in recent years following the retraction of a number of papers due to image irregularities. To that end, many major journals, including the Journal of Biological Chemistry, Cell, and Nature have specific submission guidelines, with data quality and transparency being top priorities. With this in mind, it is crucial for researchers to understand where to draw the line between improving image presentation and data manipulation when it comes to western blotting.
Understanding data misrepresentation through image manipulation
Western blot image integrity can be compromised through undisclosed, seemingly minor adjustments to the contrast, brightness, and exposure through to more deliberate edits, such as cropping out or duplicating bands or lanes, combining lanes from different gels, or rotating bands. While many of these practices can be performed inadvertently, they can mislead data interpretation.
For presentation purposes, non-destructive adjustments, such as image transformation and background subtraction are reasonable and often scientifically necessary depending on sample complexity and signal specificity. However, these adjustments must be made consistently across all lanes being analyzed and must be fully disclosed in figure legends or methods.

Thorough documentation of unprocessed image files is the most practical approach to demonstrating image integrity and strengthening the credibility of the research, while expediting the review process, as access to raw images is increasingly demanded during journal submissions. These documents include the original, unprocessed gel image; the processed image submitted for publication, with clear disclosure of adjustments; details of the image detection and processing software, and parameters used; and evidence that identical adjustments were applied to all samples being comparatively analyzed.
There are several image analysis software packages available to researchers to aid gel image analysis and quantitation. These include ImageJ, developed by the National Institutes of Health, which is widely accepted by many journals. The software preserves image data and allows creation of macros, enabling identical processing to be applied across multiple images. ImageJ quantifies signal intensity directly, so it’s suitable for a range of workflows including total protein normalization from stain-free approaches or stained images.
As with any densitometry tool, quantitation should be performed on raw images within the linear range of detection, and macros should be validated against a known standard to confirm they produce accurate, reproducible results across all images in a set. Fiji is an image processing package that facilitates analysis in ImageJ, offering integration and comprehensive documentation, and is recommended for first-time users.
Beyond this widely used option, a number of other tools serve more specific purposes, from general image editing to acquisition-integrated workflows. GNU Image Manipulation Program (GIMP), Python with scikit-image, EBImage, and Image Lab are also available to researchers and offer various capabilities:
- GIMP: GIMP is not designed for scientific quantitation but offers general-purpose image editing for cropping, documentation and annotation.
- Python with scikit-image: For researchers with programming expertise, Python with scikit-image provides full control over imaging processing pipelines.
- EBImage: Hosted within the Bioconductor Project, EBImage allows seamless integration with downstream statistical analysis using R programming.
- Image Lab: The software preserves the full context of data from acquisition through analysis within a secure traceable environment, enabling documentation and transparency of image generation and processing.
Choosing the most reliable normalization method
Alongside the choice of analysis software, reliable protein quantitation also depends on the normalization strategy used to correct for any non-biological differences between test samples prior to comparison, and the choice of method has direct implications for data integrity.
Single “Housekeeping” Protein Normalization. Traditionally, western blots have been quantified via normalization against a single loading control, typically housekeeping proteins (HKPs) such as GAPDH, β-actin or β-tubulin, which are ubiquitous, abundant and assumed to be consistently expressed. This approach is widely used, however, HKPs must be validated against positive and negative controls within the researcher’s specific experimental context to confirm consistent expression levels across samples.
As HKP expression is often considerably higher than that of target proteins, rigorous linear range determination must be established to avoid oversaturation and loss of quantitative accuracy. This process often requires several rounds of optimization of primary and secondary antibody dilution ratios, which can add significant time and complexity to the experiment.
Despite HKPs’ ubiquitous expression, their expression levels have been shown to fluctuate across different cell types, cell states, and disease states, including in cancer. Therefore, it is critical for researchers to validate their HKPs for consistent expression across different sample types and experimental conditions.
Normalizing western blots using a single loading control may require stripping and reprobing of the membrane to detect both target and control signals if the proteins run at similar molecular weights. This process can introduce variability and the potential for incomplete stripping or uneven reprobing, increasing the risk of signal variation and reducing result reliability.
Total Protein Normalization. Total protein normalization (TPN) overcomes both the linearity challenges of immunodetection and the reliance on a single control protein to represent the entire protein population (Table 1). Instead, TPN quantifies the total protein loaded in each lane, measured by collecting the signal on the membrane, to produce a normalization factor that is comprehensive and inherently stable. This can be achieved using Stain-Free technology or reversible staining methods such as Ponceau S.
One study compared the accuracy and precision of normalization of three HKPs (β-tubulin, actin and GAPDH) against Stain-Free TPN. Although β-tubulin and actin showed accuracy comparable to that of Stain-Free TPN, they exhibited lower precision, potentially reducing the reliability of the measurements. At the same time, GAPDH plateaued rapidly due to oversaturation, resulting in poor accuracy.
Another study reported similar findings by comparing the linearity of a series of dilutions obtained by Stain-Free TPN measurement as well as HKPs immunodetection, further demonstrating that Stain-Free TPN can serve as a more reliable and accurate loading control than HKPs (Figure 1).
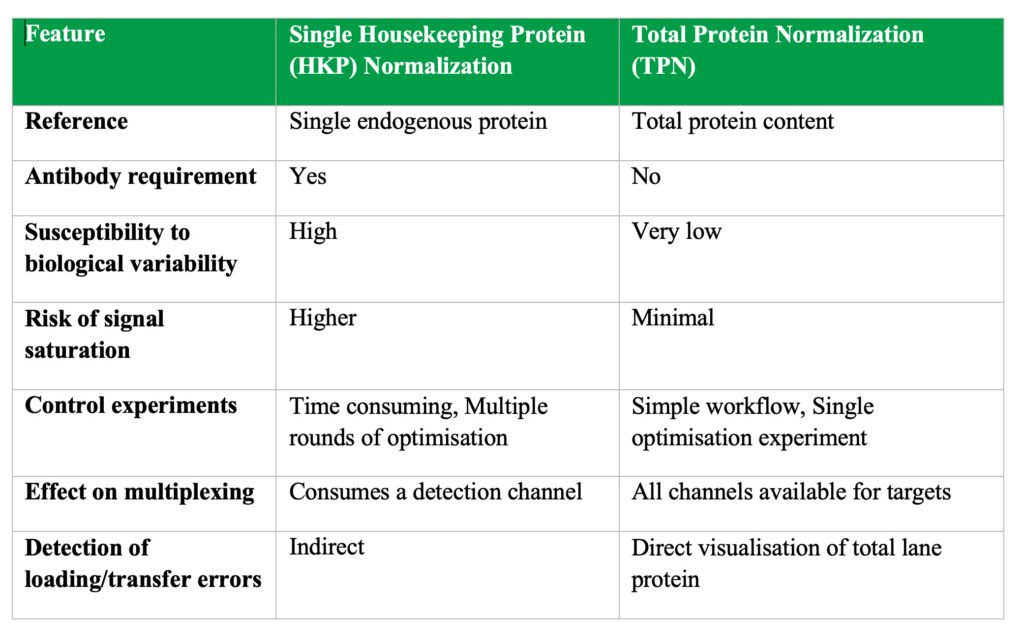
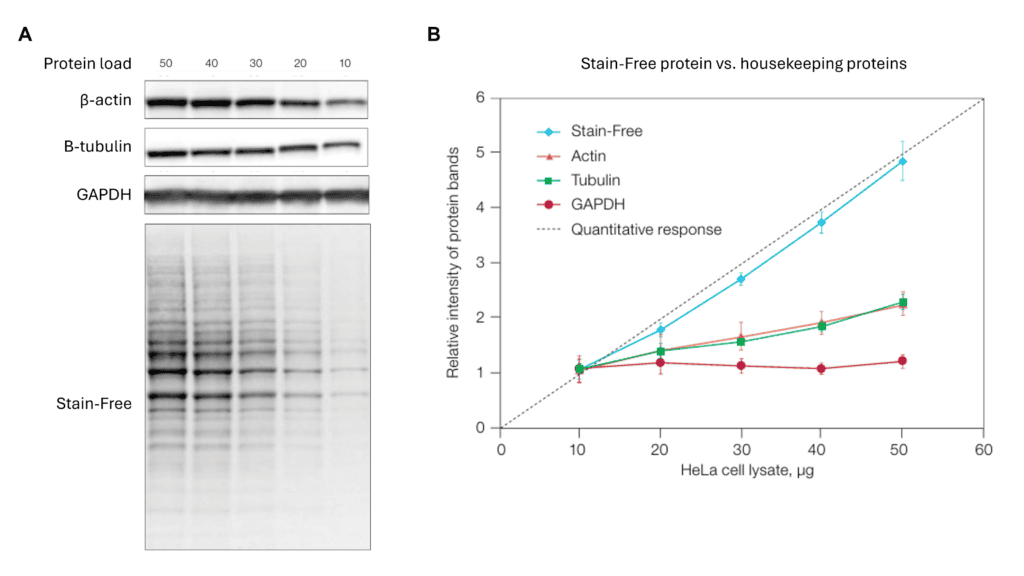
Stain-Free TPN methods were introduced to address variation in membrane sensitivity, allowing the gel and blot to be visualized through an imaging step that does not interfere with downstream immunodetection. This is particularly useful for enhancing data integrity as Stain-Free approaches provide a true scalar relationship between loading amount and signal intensity, so both target and loading signals can be quantified accurately within a linear dynamic range by normalizing each band to the total protein in each lane. This approach improves the reproducibility of TPN, and was recently shown to reduce variability compared to actin or β-tubulin normalization while also reducing the sample size needed for statistical significance by >50%.
However, researchers should be aware that since TPN reflects the whole protein population, it can obscure treatment-induced global shifts in protein expression, so the normalization approach chosen should be matched to the biological context of the experiment.
Upholding data integrity. A western blot’s quantitative reliability is dependent on the decisions made at every stage, from image acquisition and processing through to the normalization strategy applied. Rigorous documentation is essential for the transparency and integrity of published data but does not negate the other steps needed to ensure biological validity and quantitative accuracy. Central to this is the normalization method chosen to account for non-biological differences between samples.
Whichever approach is used, it must be reported and accompanied by an explanation of why it was the most suitable choice for the experiment and its biological context. While there are no fixed requirements on which normalization method researchers should follow, many journals now strongly recommend the use of TPN and stress that HKPs should only be used where there is strong evidence that their expression is unaffected by the experimental conditions.
Together, transparent audit-ready documentation, careful tool selection and a well-justified normalization strategy form the foundation of credible, reproducible western blot data, and meet the growing expectations of journals and the wider research community.
Nikolas Chmiel, PhD, is associate director R&D, life science group, Bio-Rad Laboratories.